CPI Aug2026
As of the time of this post, here is the latest CPI report; August2026
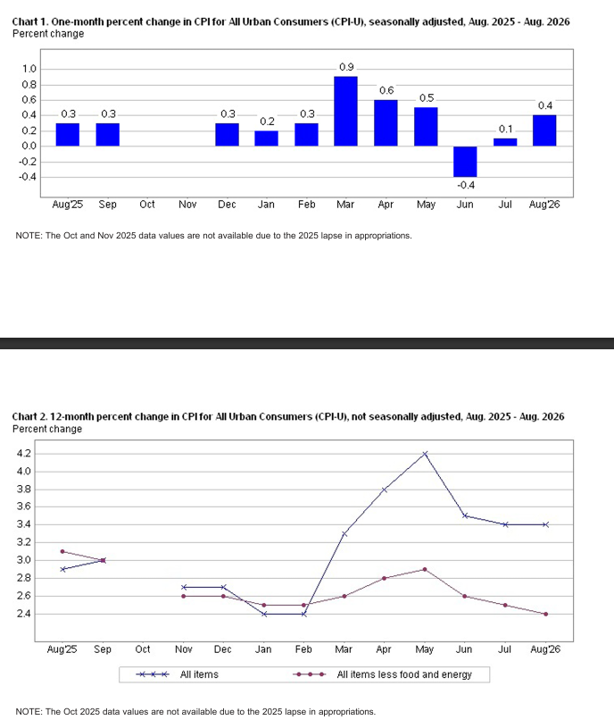
Visit the latest report to answer the following questions.
Table A. Which category grew the fastest in Aug vs Jul? Why can’t we use Table A to determine if the category that grew the fastest, contributed the most to the headline CPI growth?
Energy was the leader, up 2.1%. Among Energy, we saw Fuel oil up 10.1% in the month.
However, these growth rates don’t indicate the relative weight of energy within the CPI basket, and thus we can’t make a claim about an attribution analysis.
Table 1: What are the relative importance values of Food, Energy, and All other items? Compare and contrast the Aug2026 behavior for Food vs Energy given these importance weights.
- Food: 13.5%
- Energy: 7.3%
- Energy grew much faster, but is a smaller weight. The implication is that energy’s 2.1% m/m in Aug may not have contributed as much to the overall CPI as if had the same importance as Food.
Table 1: What is the most important single category? Note: There are different levels to the hierarchy (categories, subcategories, subsubcategories, etc.. ). Use your discretion and identify which single level is the biggest?
Shelter makes up roughly 35% of the CPI.
OER is about 26% of that 35% total.
Table 1. Energy. Compare “unadjusted” and “seaonally adjusted” growth for Augu2026.
What is the implication?
- NSA: 1.3%
- SA: 2.1%
- The NSA measure reflects the raw observed change. The SA measure removes the typical seasonal pattern for that period. Because growth is 1.3% NSA but 2.1% SA, the usual seasonal pattern was pulling measured growth down by roughly 0.8 percentage points. After removing that seasonal drag, the underlying month-to-month movement appears stronger.
- Suppose prices normally fall during a particular month because of recurring seasonal discounts. If prices fall less than usual, or even rise, then the NSA growth rate may look weak, while the SA growth rate will be higher because the normal seasonal decline has been removed.
Table 6. Interpret the standard error for Food.
- BLS estimates that food prices increased by 0.1% from July to August. However, because the CPI is estimated from a sample of prices, the estimate has sampling uncertainty.
- Using approximately two standard errors, the plausible range for the underlying one-month change is about −0.06% to 0.26%. \(0.1 \pm 2(.08) = [-0.06,.26]%\)
- Because zero lies within this interval, the estimated increase is not statistically distinguishable from zero at the 5% level.
Table6: What was the contribution of Food, Energy, and “other” to Aug2026 CPI growth?
- Headline: 0.40
- Food: 0.017
- Energy: 0.15
- Other: 0.30
Table 4: WHERE was Aug y/y inflation above national avg?
- Total: 3.4%
- Northeast: 3.9%
- Midwest: 3.6%
- West: 3.2%
- South: 3.1%